As a large-scale fast food chain, Chick-fil-A had a need for keeping sales records for each licensee locations. The dashboard needed 2 parts: the licensee sales portal and administrative portal
The prior dashboard design was antiquated and made it difficult and cumbersome for users to correctly input monthly sales. In addition, it lacked a way for users to go back and rectify errors.
Objectives
Design a licensee sales portal (LSP) that serves as a directory to keep track of sales records
Design an administrative sales portal (ASP) where accountants and administrators can use to close the books
The transformation:
Before (2022)
After (2023)
Licensee Sales Portal (LSP)
Dashboard features for licensees
UI design included:
Calendar inputs for monthly sales
Inputs for third party mobile app sales, and monthly catering sales
Upload file feature for monthly sales report
Total monthly sales record
Submission status directory
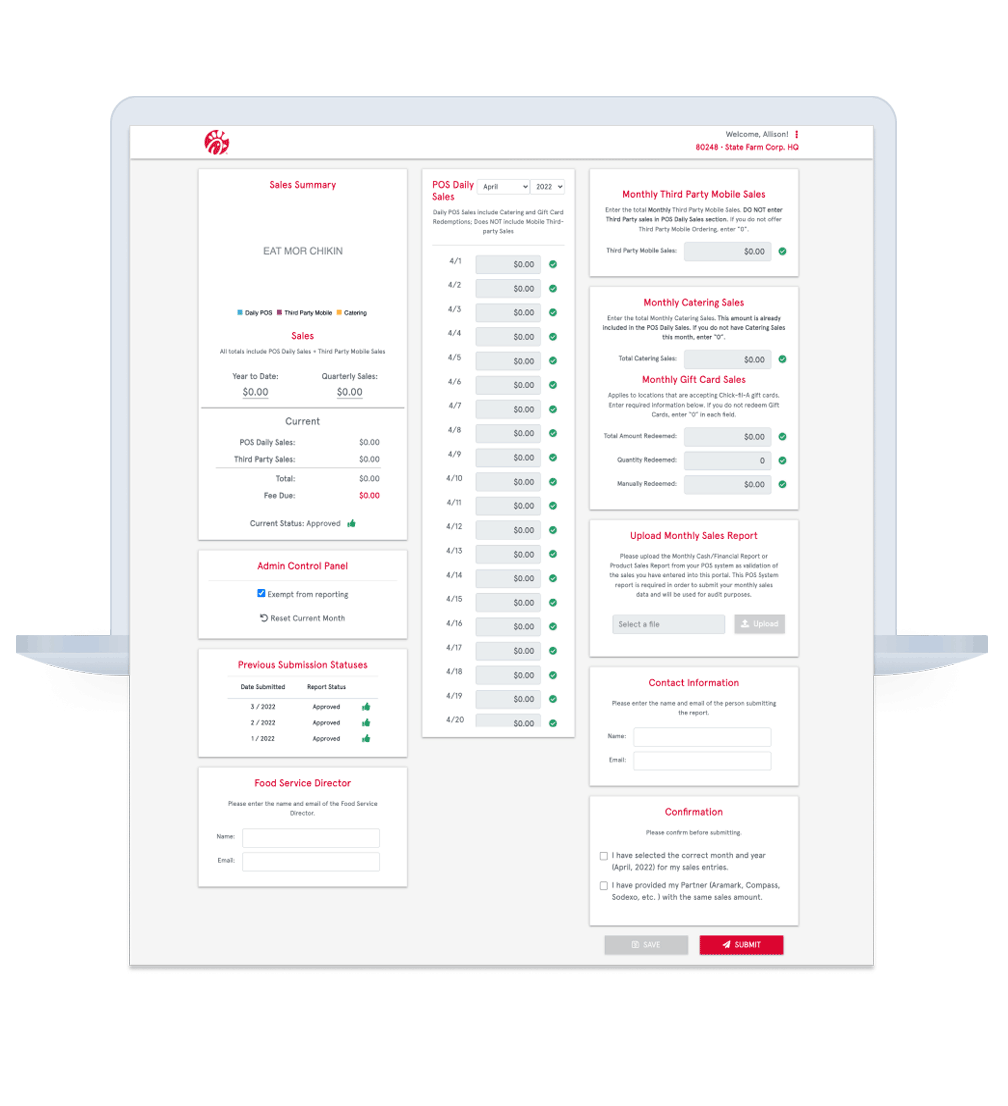
Dashboard features for Licensee Sales Portal (LSP)
Step 1.
Licensee location manager inputs monthly sales in the calendar forms separated by each day of the month.
Step 2.
Then, they input third-party mobile app sales, monthly catering sales and upload the monthly sales report in PDF form.
After that, the contact information, name of the food service director and other contingencies get confirmed by the checkboxes
The final step is either saving the form as a draft or submitting it.
Step 3.
If the manager decides to save a draft, there is a Submission Status section after the form that serves as a directory to view Monthly Sales listed in chronological order.
Administrative Sales Portal (ASP)
Dashboard features for administrators
UI design included:
Review for pending submissions
Licensee location directory
Modals to include individual licensee locations
Ability to approve and deny sales submissions
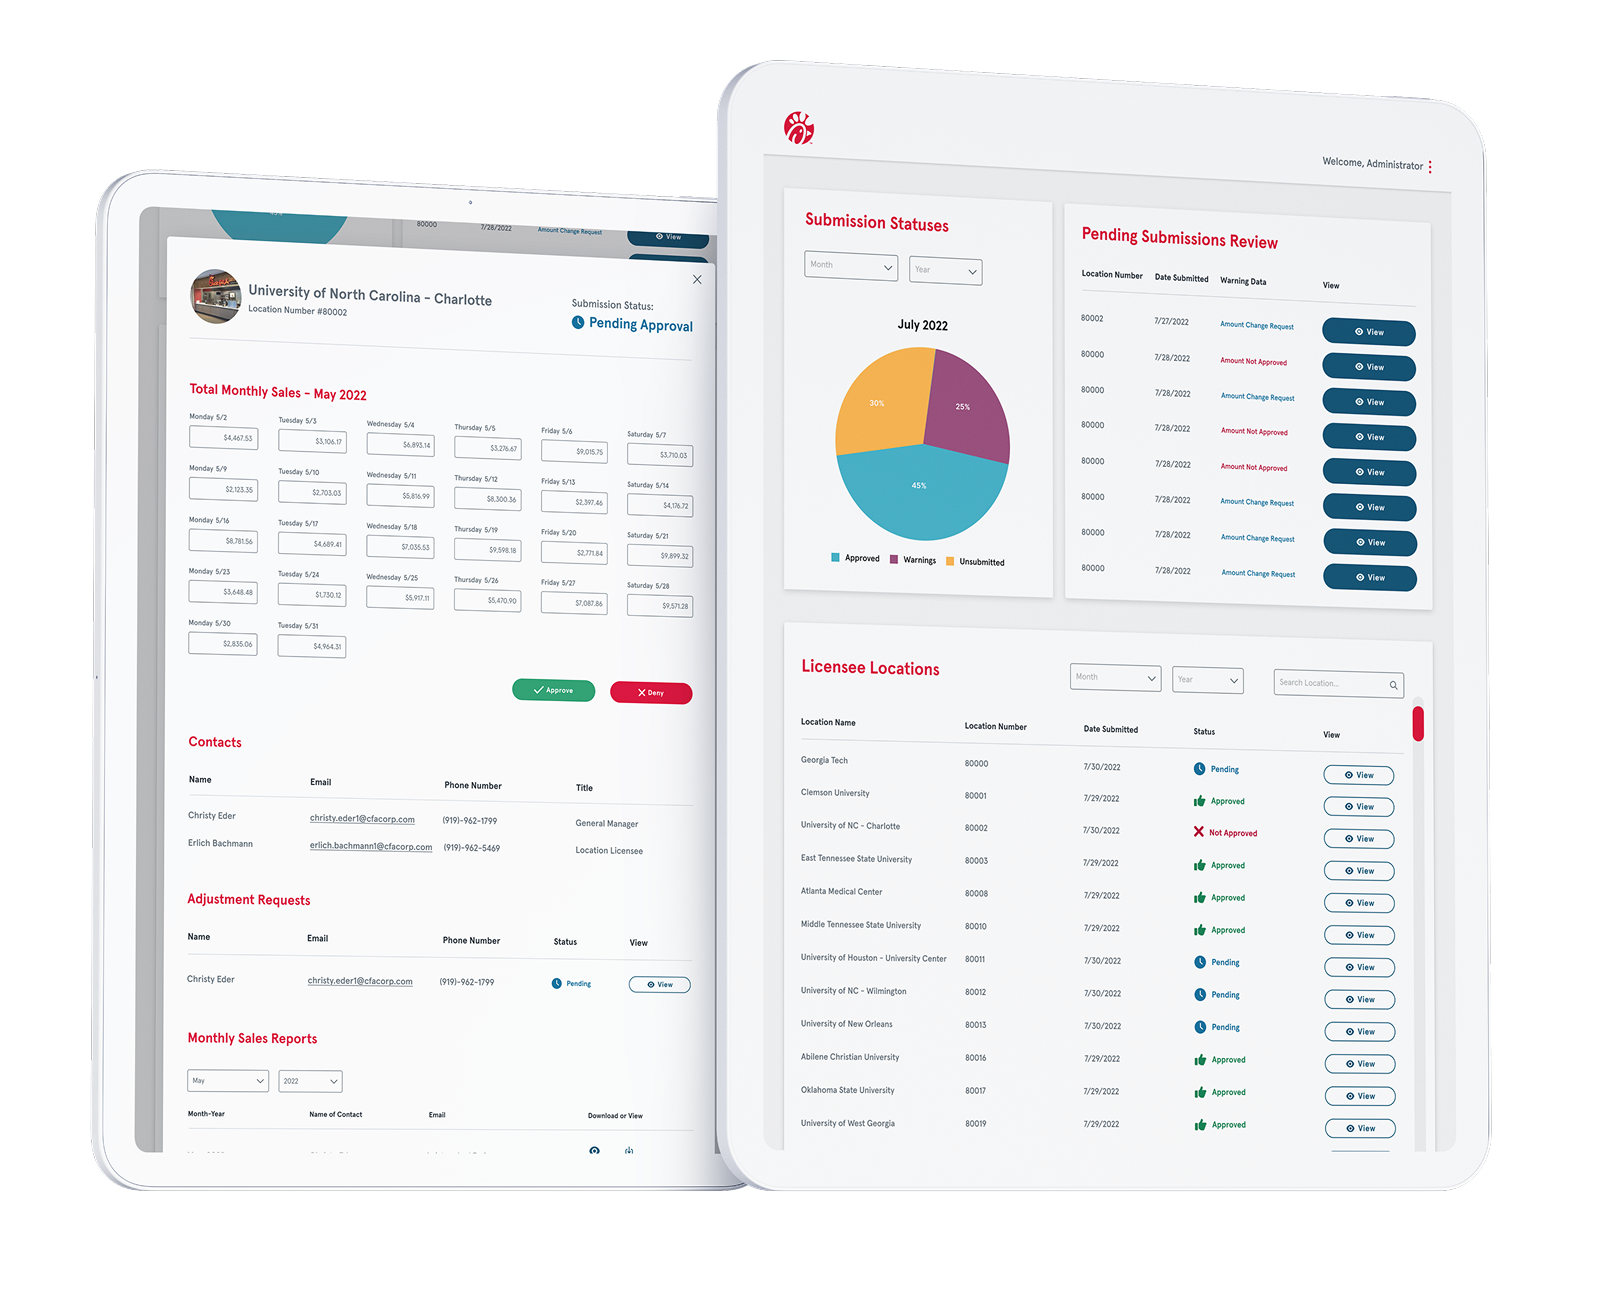
Dashboard features for Administrative Sales Portal (ASP)
Step 1.
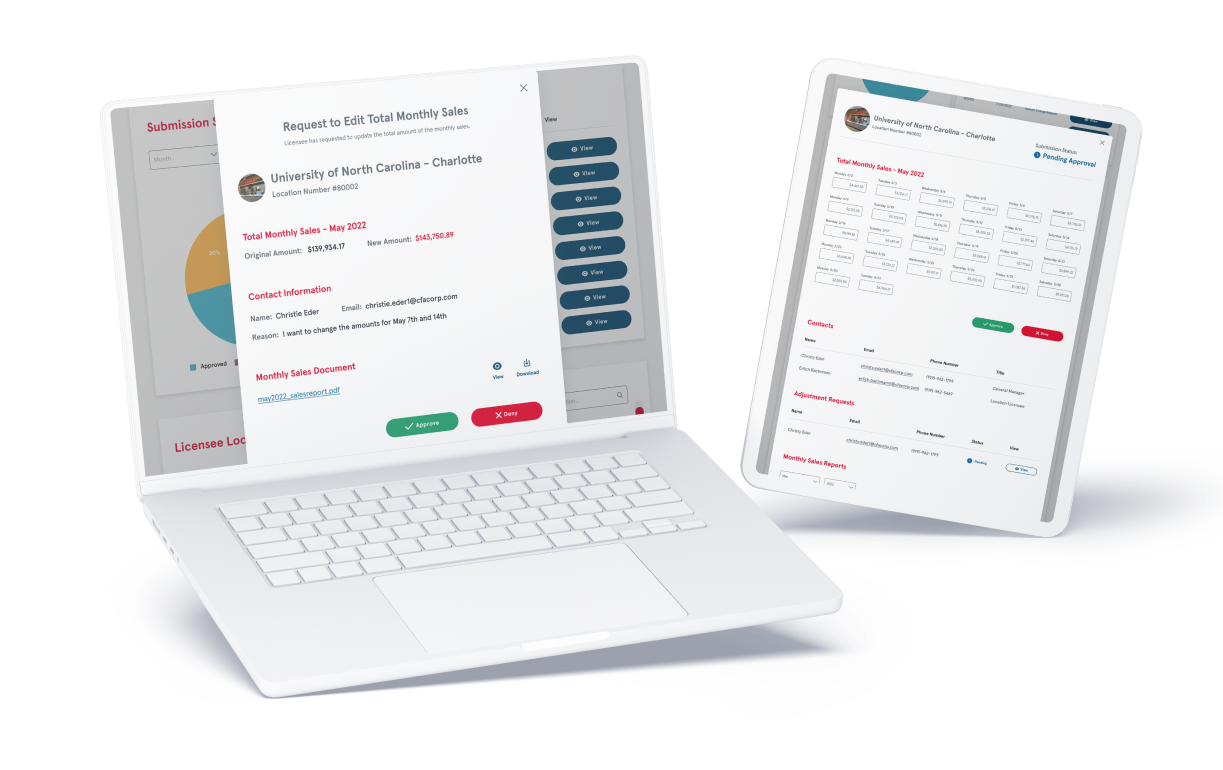
The administrator (who is usually an accountant or Regional Director) sees the pending monthly sales submissions that have yet to be approved.
Once the “View” CTA is clicked, a modal appears giving them a view on a specific location’s total sales for a given month.
From there, administrator will approve or deny the submission.
Step 2.
The Licensee Location section was designed so that the administrator can see all the locations and their statuses on one easy-to-read dashboard rather than combing through a messy excel sheet.
In this example, the administrator sees a location they need to approve, and then simply clicks the “View” CTA. Then, a modal appears to give them insights on that specific location.
Outcomes
Here were the outcomes of the sales portal dashboard design:
Reduced help desk tickets by 20% in the first quarter following new UI launch
Improved system response time to under 1.5 seconds and reduced loading speeds to under 2 seconds for all usage periods within 12 months
Increased the accuracy of sales data entries to 98.6% by reducing errors to 1.4%
Reduced the time taken for daily, weekly and monthly sales reconciliations by 34%
Reduced errors in monthly and quarterly revenue reporting by over 52% through improved reporting form submissions
Licensee Visit Report
My role:
UX Designer & Researcher
Timeline: 6 Months
Problem Statement
As a large-scale fast food chain, Chick-fil-A had a need for keeping sales records for each licensee locations. The dashboard needed 2 parts: the licensee sales portal and administrative portal
The prior dashboard design was antiquated and made it difficult and cumbersome for users to correctly input monthly sales. In addition, it lacked a way for users to go back and rectify errors.
Objectives
Design a licensee sales portal that serves as a directory to keep track of sales records
Design an administrative sales portal where accountants and administrators can use to close the books
The transformation:
Before (April 2022)
After (January 2023)
Licensee Sales Portal (LSP)
Dashboard features for licensees
UI design included:
Calendar inputs for monthly sales
Inputs for third-party mobile app sales, and monthly catering sales
Upload file feature for monthly sales report
Total monthly sales record
Submission status directory
Dashboard features for Licensee Sales Portal (LSP)
Step 1.
Licensee location manager inputs monthly sales in the calendar forms separated by each day of the month.
Step 2.
Then, they input third-party mobile app sales, monthly catering sales and upload the monthly sales report in PDF form.
After that, the contact information, name of the food service director and other contingencies get confirmed by the checkboxes
The final step is either saving the form as a draft or submitting it.
Step 3.
If the manager decides to save a draft, there is a Submission Status section after the form that serves as a directory to view Monthly Sales listed in chronological order.
Administrative Sales Portal (ASP)
Dashboard features for administrators
UI design included:
Review for pending submissions
Licensee location directory
Modals to include individual licensee locations
Ability to approve and deny monthly sales submissions
Dashboard features for Administrative Sales Portal (ASP)
Step 1.
The administrator (who is usually an accountant or Regional Director) sees the pending monthly sales submissions that have yet to be approved.
Once the “View” CTA is clicked, a modal appears giving them a view on a specific location’s total sales for a given month.
From there, administrator will approve or deny the submission.
Step 2.
The Licensee Location section was designed so that the administrator can see all the locations and their statuses on one easy-to-read dashboard rather than combing through a messy excel sheet.
In this example, the administrator sees a location they need to approve, and then simply clicks the “View” CTA. Then, a modal appears to give them insights on that specific location.
Outcomes
Here were the outcomes of the sales portal dashboard design:
Reduced help desk tickets by 20% in the first quarter following new UI launch
Improved system response time to under 1.5 seconds and reduced loading speeds to under 2 seconds for all usage periods within 12 months
Increased the accuracy of sales data entries to 98.6% by reducing errors to 1.4%
Reduced the time taken for daily, weekly and monthly sales reconciliations by 34%
Reduced errors in monthly and quarterly revenue reporting by over 52% through improved reporting form submissions
My role:
UX Designer & Researcher
Timeline: 6 Months
Objectives
Design a licensee sales portal that serves as a directory to keep track of sales records
Design an administrative sales portal where accountants and administrators can use to close the books
The transition:
Before
After
Licensee Sales Portal (LSP)
Dashboard features for licensees
UI design included:
Calendar inputs for monthly sales
Inputs for third party mobile app sales, and monthly catering sales
Upload file feature for monthly sales report
Total monthly sales record
Submission status directory
Dashboard features for Licensee Sales Portal (LSP)
Step 1.
Licensee location manager inputs monthly sales in the calendar forms separated by each day of the month.
Step 2.
Then, they input third-party mobile app sales, monthly catering sales and upload the monthly sales report in PDF form.
Step 3.
If the manager decides to save a draft, there is a Submission Status section after the form that serves as a directory to view Monthly Sales listed in chronological order.
Administrative Sales Portal (ASP)
Dashboard features for administrators
UI design included:
Review for pending submissions
Licensee location directory
Modals to include individual licensee locations
Ability to approve and deny monthly sales submissions
Dashboard features for Administrative Sales Portal (ASP)
Step 1.
The administrator (who is usually an accountant or Regional Director) sees the pending monthly sales submissions that have yet to be approved.
Step 2.
The administrator sees a location they need to approve, and then simply clicks the “View” CTA. Then, a modal appears to give them insights on that specific location.
Outcomes
Here were the outcomes of the sales portal dashboard design:
Reduced help desk tickets by 20% in the first quarter following new UI launch
Increased the accuracy of sales data entries to 98.6% by reducing errors to 1.4%
Reduced the time taken for daily, weekly and monthly sales reconciliations by 34%
Reduced errors in monthly and quarterly revenue reporting by over 52% through improved reporting form submissions